
Air-Cooled Laser Upgrade


Comparison of FLIPR® Fluorescence Reader with Air-Cooled Laser and FLIPR® Fluorescence Reader with Water-Cooled Laser
Goal:
To determine if the air-cooled laser significantly impacts assay performance as compared to the water-cooled laser.
Materials and Methods:
Two cell lines with well-established protocols using a FLIPR® 1 water-cooled laser were used in the study. Briefly, cells plated in 96 wells were hand washed, incubated 1 h using 2 uM Fluo-4AM/Pluronic Acid (LIFE), hand washed then assayed using FLIPR®. Agonist does response curves were generated. The FLIPR® water-cooled laser was removed and replaced with an air-cooled laser. The laser was aligned as with the water-cooled laser. The signal test plate gave a saturated signal at f-stop 2, 0.1 sec exposure time, so the f-stop was changed to 4 (decreasing in signal of about 75%).
Conclusion
The air-cooled laser can be retrofitted and aligned to existing FLIPR® optics. The Black Dog air-cooled laser* provides so much power that the signal needs attenuating, and the signal test is similar to using a water-cooled laser when comparing dye loaded cells. There was no significant difference in experimental results between the two laser sources, as indicated.
The air-cooled laser can be retrofitted and aligned to existing FLIPR® optics.
The air-cooled laser provides so much power that the signal needs attenuating (f-stop number increased).
The air-cooled laser system’s signal test is similar to using the water cooled laser when comparing dye loaded cells.
No significant difference in experimental results between laser sources is indicated.

Figure 1. Signal test results of cell line 1 using water-cooled and air-cooled laser. The average and standard deviation of each plate is indicated. The SEM range is similar; with increased exposure time, the average counts using the air-cooled laser are similar to those of the water-cooled laser.Research by:
Figure 2 & 3. Comparison of cell 1 traces using water-cooled laser versus air-cooled laser. Assay performance is similar. Agonists concentrations in uM are indicated.

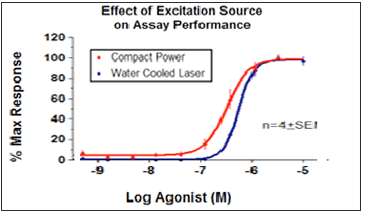
Figure 4. Does response curves of cell line 2. Maximal response was set to 100%. The pEC50 are similar (6.5 vs. 6.3).
*Patented
